FREQUENCY function in Excel
The FREQUENCY function in Excel calculates how often values occur within the ranges you specify in a bin table. You can also use the COUNTIFS function to create a frequency distribution.
1. First, enter the bin numbers (upper levels) in the range C4:C8.
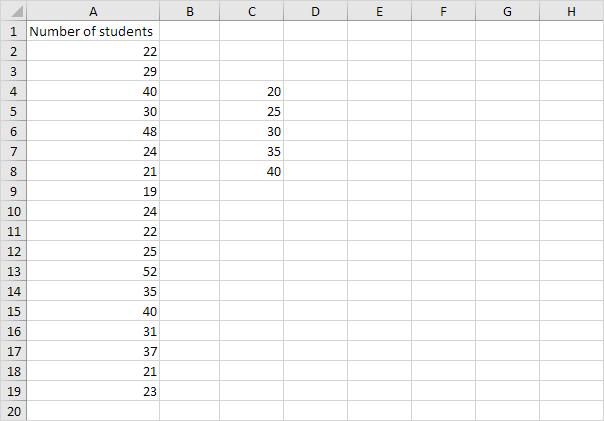
2. Select the range D4:D9 (extra cell), enter the FREQUENCY function shown below (without the curly braces) and finish by pressing CTRL + SHIFT + ENTER.
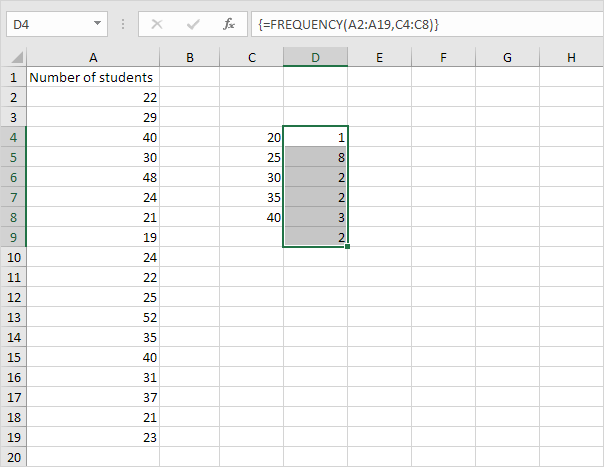
Note: the formula bar indicates that this is an array formula by enclosing it in curly braces {}. To delete this array formula, select the range D4:D9 and press Delete.
3. If you have Excel 365 or Excel 2021, simply select cell D4, enter the FREQUENCY function and press Enter. Bye bye curly braces.
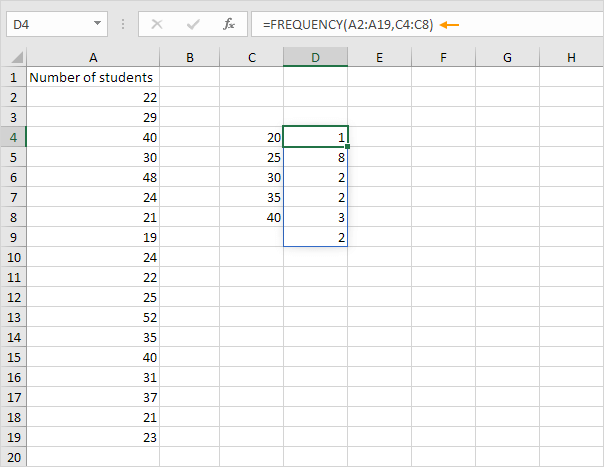
Note: the FREQUENCY function, entered into cell D4, fills multiple cells. Wow! This behavior in Excel 365/2021 is called spilling.
4. Hide the column with the bin numbers (upper levels) and insert a column with proper bin labels.

Explanation: 1 value is less than or equal to 20, 8 values are greater than or equal to 21 and less than or equal to 25, etc. At step 2, we selected the range D4:D9 (instead of the range D4:D8). As a result, the FREQUENCY function also counts the number of values that are greater than 40.
5. You can also use the Analysis Toolpak to create a histogram.

6. Change the bin numbers. Select the range D4:D9 (no extra cell), enter the FREQUENCY function shown below (without the curly braces) and finish by pressing CTRL + SHIFT + ENTER.
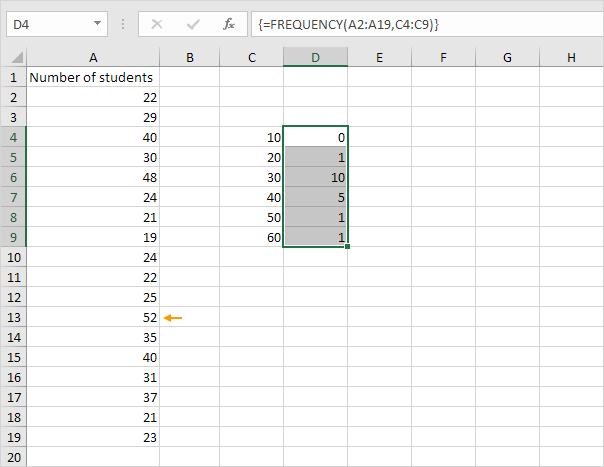
Explanation: the last bin number is greater than or equal to the maximum value (52). As a result, we don't need an extra cell to count the number of values that are greater than 60.
7. You can also use the COUNTIFS function to create a frequency distribution.
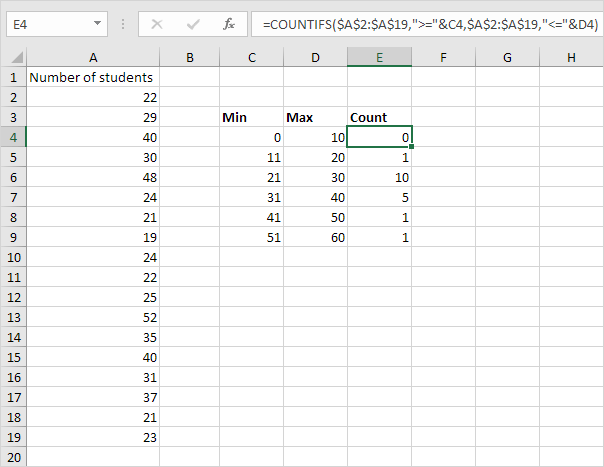
Explanation: the COUNTIFS function in Excel counts cells based on two or more criteria. The COUNTIFS function shown above has 2 range/criteria pairs. The & operator joins ">=" with the value in cell C4 and "<=" with the value in cell D4. You can easily copy this formula to the other cells.