Percentiles and Quartiles in Excel
This example teaches you how to use PERCENTILE and QUARTILE in Excel. Below you can find a list of scores (green fill for illustration only).
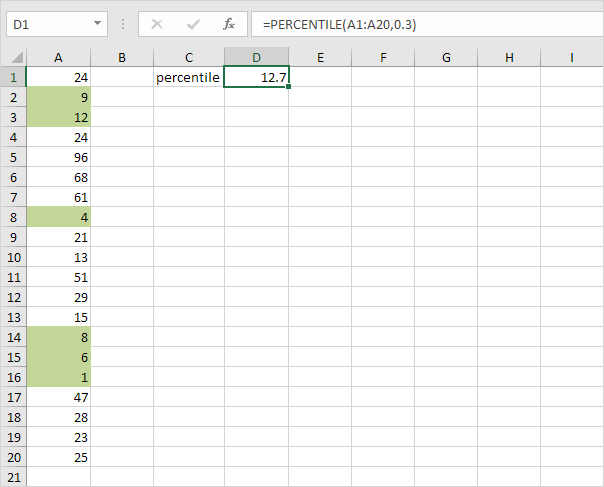
1. Use the PERCENTILE function shown below to calculate the 30th percentile. Excel returns the value 12.7. This means that 30% (6 out of 20) of the scores are lower or equal to 12.7

Note: The second argument of the PERCENTILE function must be a decimal number between 0 and 1. Excel uses a slightly different algorithm to calculate percentiles and quartiles than you find in most statistics books. If you're interested, download the Excel file.
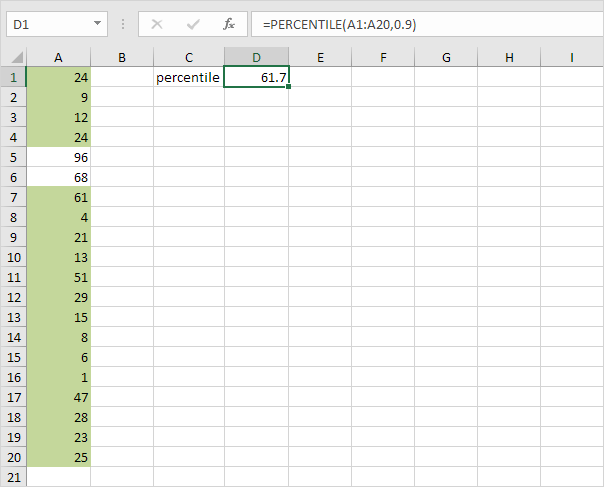
2. Use the PERCENTILE function shown below to calculate the 90th percentile. Excel returns the value 61.7. This means that 90% (18 out of 20) of the scores are lower or equal to 61.7

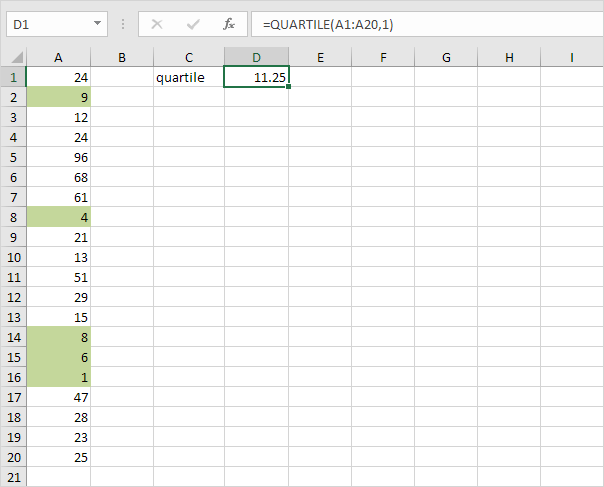
3. Use the QUARTILE function shown below to calculate the 1st quartile. Excel returns the value 11.25. This means that 25% (5 out of 20) of the scores are lower or equal to 11.25

Note: The second argument of the QUARTILE function must be a number between 0 and 4. PERCENTILE(A1:A20,0.25) gives the exact same result. It's up to you which function you would like to use for quartiles. Below you can find an overview.
| Minimum Value | PERCENTILE(A1:A20,0) | QUARTILE(A1:A20,0) | MIN(A1:A20) |
|---|---|---|---|
| 1st Quarter | PERCENTILE(A1:A20,0.25) | QUARTILE(A1:A20,1) | |
| Median | PERCENTILE(A1:A20,0.50) | QUARTILE(A1:A20,2) | MEDIAN(A1:A20) |
| 3rd Quarter | PERCENTILE(A1:A20,0.75) | QUARTILE(A1:A20,3) | |
| Maximum Value | PERCENTILE(A1:A20,1) | QUARTILE(A1:A20,4) | MAX(A1:A20) |