Create a Bar Chart in Excel
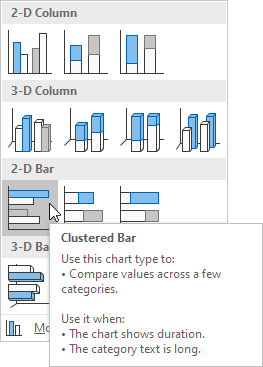
A bar chart is the horizontal version of a column chart. Use a bar chart if you have large text labels.
To create a bar chart, execute the following steps.
1. Select the range A1:B6.

2. On the Insert tab, in the Charts group, click the Column symbol.

3. Click Clustered Bar.

Result:
