Solve a Quadratic Equation in Excel
A quadratic equation is of the form ax2 + bx + c = 0 where a ≠ 0. A quadratic equation can be solved by using the quadratic formula. You can also use Excel's Goal Seek feature to solve a quadratic equation.
1. For example, we have the formula y = 3x2 - 12x + 9.5. It's easy to calculate y for any given x. For x = 1, y = 0.5

2. For x = 2, y = -2.5

3. But what if we want to know x for any given y? For example, y = 24.5. We need to solve 3x2 - 12x + 9.5 = 24.5. We can solve the quadratic equation 3x2 - 12x + 9.5 - 24.5 = 0 by using the quadratic formula.
3x2 - 12x -15 = 0
a = 3, b = -12, c = -15
D = b2- 4ac = (-12)2 - 4 * 3 * -15 = 144 + 180 = 324
| x = | -b + √D | or | x = | -b - √D |
| 2a | 2a |
| x = | 12 + √324 | or | x = | 12 - √324 |
| 6 | 6 |
| x = | 12 + 18 | or | x = | 12 - 18 |
| 6 | 6 |
| x = | 5 | or | x = | -1 |
4. You can use Excel's Goal Seek feature to obtain the exact same result. On the Data tab, in the Forecast group, click What-If Analysis.

5. Click Goal Seek.

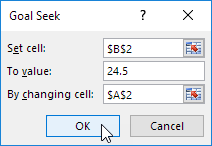
The Goal Seek dialog box appears.
6. Select cell B2.
7. Click in the 'To value' box and type 24.5
8. Click in the 'By changing cell' box and select cell A2.
9. Click OK.

Result:

Note: Excel returns the solution x = 5. Excel finds the other solution (x = -1) if you start with an x-value closer to -1. For example, enter the value 0 into cell A2 and repeat steps 5 to 9. To find the roots, set y = 0 and solve the quadratic equation 3x2 - 12x + 9.5 = 0. In this case, set 'To value' to 0.
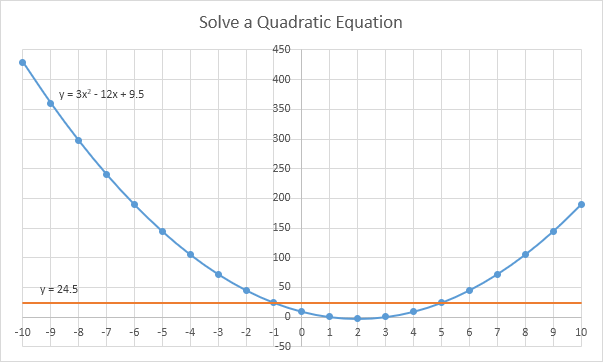
Bonus! Improve your understanding of quadratic equations by visualizing the solutions on a chart. Let's visualize the solutions of y = 3x2 - 12x + 9.5 = 24.5.
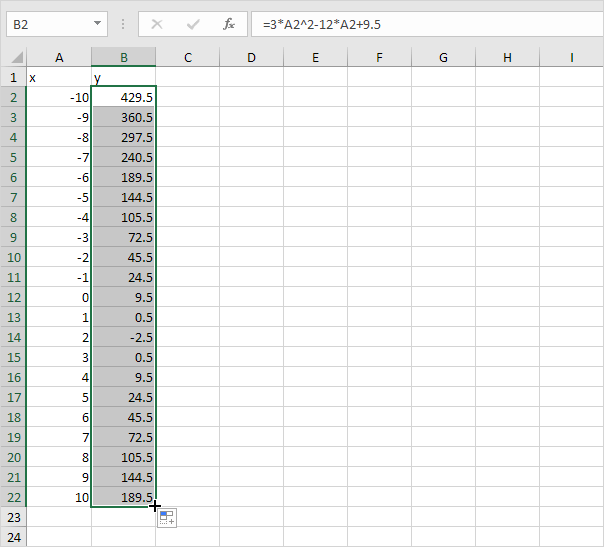
10. Populate column A with multiple x-values and find their corresponding y-values by dragging the formula in cell B2 down.

11. Create an XY scatter chart and add a horizontal line (y = 24.5) to the chart. If you're interested, you can download the accompanying Excel file.

Explanation: the points where the curve intersects the horizontal line represent the solutions to the quadratic equation for the given y-value. You can clearly see the solutions x = -1 and x = 5.