Sensitivity Analysis in Excel
Sensitivity analysis gives you insight into how the optimal solution changes when you change the coefficients of the model. After the solver found a solution, you can create a sensitivity report.
1. Before you click OK, select Sensitivity from the Reports section.
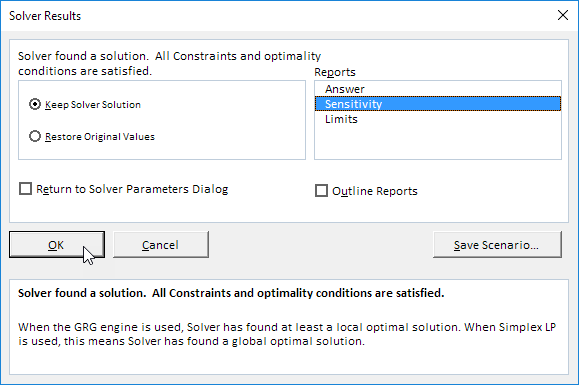
Below you can find the optimal solution and the sensitivity report.
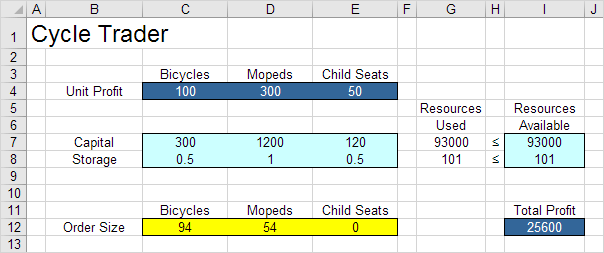
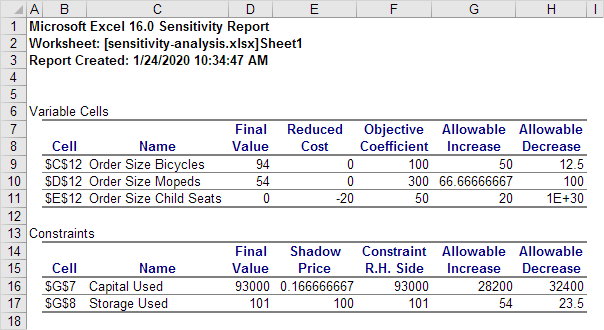
It is optimal to order 94 bicycles and 54 mopeds. This solution gives the maximum profit of 25600. This solution uses all the resources available (93000 units of capital and 101 units of storage). You can find these numbers in the Final Value column.
Reduced Cost
The reduced costs tell us how much the objective coefficients (unit profits) can be increased or decreased before the optimal solution changes. If we increase the unit profit of Child Seats by 20 or more units, the optimal solution changes.
1. At a unit profit of 69, it's still optimal to order 94 bicycles and 54 mopeds. Below you can find the optimal solution.
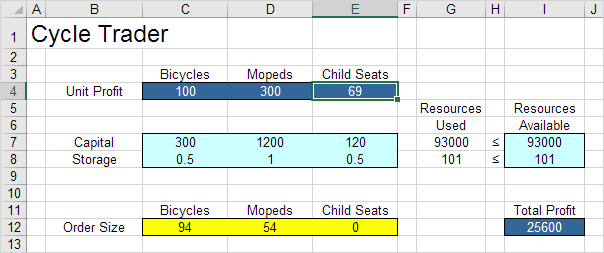
2. At a unit profit of 71, the optimal solution changes.
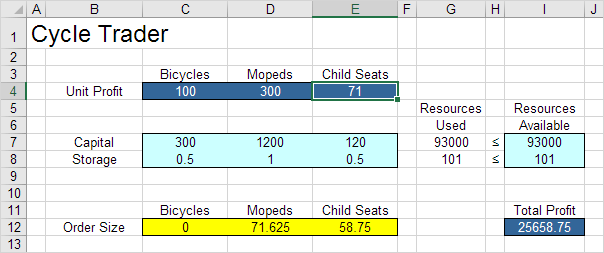
Conclusion: it is only profitable to order child seats if you can sell them for at least 70 units.
Shadow Price
The shadow prices tell us how much the optimal solution can be increased or decreased if we change the right hand side values (resources available) by one unit.
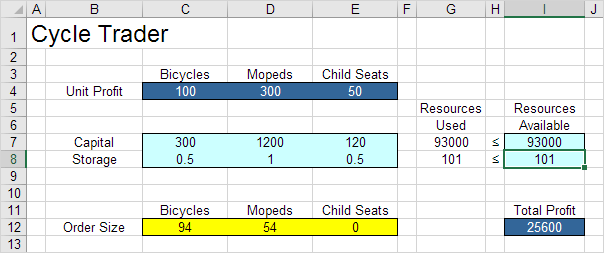
1. With 101 units of storage available, the total profit is 25600. Below you can find the optimal solution.
2. With 102 units of storage available, the total profit is 25700 (+100).
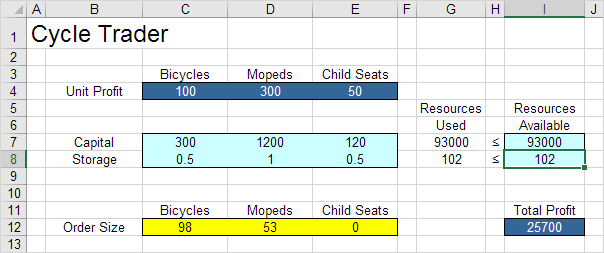
Note: with a shadow price of 100 for this resource, this is according to our expectations. This shadow price is only valid between 101 - 23.5 and 101 + 54 (see sensitivity report).